
Laser Cutting Ocean Floor Contour Maps In-Person
Note: This workshop will be held in person
About This Workshop
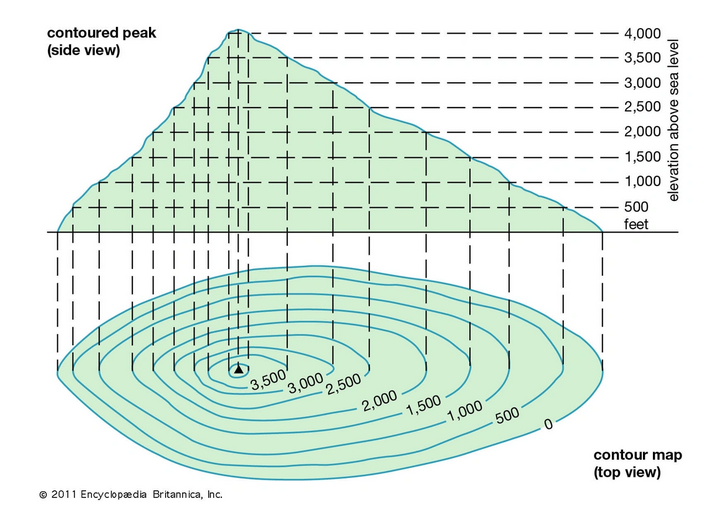
Bathymetry is the study and visualization of the ‘beds’ or ‘floors’ of bodies of water, and helps us create ocean floor contour maps. A bathymetric map of Victoria Harbour would show contours of the ocean floor and relative water depth. It can be thought of as underwater topography. Contour maps are a way of displaying elevation change in a 2D format. Areas of equal elevation are connected by concentric lines at set intervals. The example below shows 500 metre elevation increases. In addition to being useful for navigation, planning, and visualization, contour maps can also be quite beautiful and make a good subject for artistic mapping.
QGIS is a geographic information system software that is free and open-source. It supports viewing, editing, printing, and analysis of geospatial data in a range of data formats. Inkscape is a free and open source design tool for making and editing vector graphics. Inkscape uses the standardized SVG file format as its main format, which is supported by many other applications including web browsers.
Please note that it is recommended that you complete the Intro to Design with Laser Cutting workshop and at least one of the Intro to QGIS workshops before starting this tutorial.
(Note: If you are a staff member at UVic and are wanting to install software on a work computer, you may require system admin permission to do so.)
- Date:
- Wednesday, June 25, 2025
- Time:
- 10:30am - 12:00pm
- Time Zone:
- Pacific Time - US & Canada (change)
- Location:
- Digital Scholarship Commons A308
- Audience:
- Faculty and instructors Graduate students Undergraduate students UVic staff
- Categories:
- DSC